The Chandra X-ray Observatory

The Chandra X-ray Observatory is NASA's premier X-ray astronomy mission.
It was named as the Chandra X-ray Observatory in honour of the late
Indian-American Nobel laureate, Subrahmanyan Chandrasekhar. Chandra was
designed to provide an order-of-magnitude advances over previous X-ray
astronomy missions with regards to spatial and spectral resolution.
Chandra's High Resolution Mirror Assembly produces images of the point
spread function (PSF ) of <0.5 arcsec. Two grating systems - the
Low Energy Transmission Grating (LETG ) and the High Energy Transmission
Grating (HETG ) - offer resolving powers well in excess of 500 over much
of their bandwidth
which, together, cover the range from 0.1 to 10 keV. The principal
elements of the observatory are:
1. The High Resolution Mirror Assembly (HRMA)--
The HRMA consists of a nested
set of four paraboloid-hyperboloid (Wolter-1) grazing-incidence X-ray
mirror pairs,
with the largest having a diameter of 1.2 m (twice that of the Einstein
Observatory).
The focal length is 10m.
Figure 1. Hogh Resolution mirror Assembly.

2. The Advanced CCD Imaging Spectrometer (ACIS) -- The Advanced CCD Imaging Spectrometer (ACIS ) offers the capability to simultaneously acquire high-resolution images and moderate resolution spectra. The instrument can also be used in conjunction with the High Energy Transmission Grating (HETG ) to obtain very high resolution spectra. ACIS contains 10 planar, 1024 x 1024 pixel CCD s (Figure 2); four arranged in a 2x2 array (ACIS-I ) used for imaging, and six arranged in a 1x6 array (ACIS-S) used either for imaging or as a grating readout.

3. The High Resolution Camera (HRC) -- The HRC is comprised of two microchannel plate (MCP ) imaging detectors: the HRC-I designed for wide-field imaging; and, HRC-S designed to serve as a readout for the LETG . The HRC-I is placed at right angles to the optical axis, tangent to the focal surface. The HRC-S is made of three flat elements, the outer two of which are tilted to approximate the LETG Rowland circle. The HRC detectors have the highest spatial resolution on Chandra , matching the HRMA point spread function most closely.

One of the above four focal plabe instruments (2 ACISs and 2 HRCs) can
be used at a time in conjuction with the HRMA. All the four detector
systems are housed in a module, called Science Instrument Module (SIM),
which provides the ability to move and adjust any desired detector system.
The arrangement of detectors is shown in Figure 4.
Figure 4. Arrangement of the ACIS and the
HRC in the focal plane.
The view is along the axis of the telescope from the direction of
the mirrors.

4. The High Energy Transmission Grating Spectrometer (HETGS) -- In operation with the High Resolution Mirror Assembly (HRMA ) and a focal plane imager, the complete instrument is referred to as the HETGS -- the High-Energy Transmission Grating Spectrometer.
There are two sets of gratings, each with different
period. One set, the medium energy grating (MEG) is optimized for medium
energies (0.4-5.0 keV, 31-2.5 angstrom). The second set, the high energy
grating (HEG) is optimized for high energies (0.8-10.0 keV, 15-1.2 angstrom).
The two sets of gratings are mounted with their rulings
at different angles so that the dispersed images from the HEG and MEG
will form a
shallow Xcentered at the undispersed (zeroth order) position; one leg
of the X is from the HEG , and the other from the MEG .
The HETG is designed for use with the spectroscopic array of the Chandra CCD Advanced Imaging Spectrometer (ACIS-S). The HETG provides for high resolution spectroscopy (with up to 1000) between 0.4 keV and 10.0 keV.
5. Low Energy Transmission Grating Spectrometer (LETGS) -- The LETGS is cnsists of a Low energy transmission grating, a focal plane imaging detector (HRC-S or ACIS-S), and the High Resolution Mirror Assembly. The LETGS provides high-resolution spectroscopy ( >1000) between 80 and 175 angstrom (0.07 - 0.15 keV) and moderate resolving power at shorter wavelengths. The nominal LETGS wavelength range accessible with the HRC-S is 1.2 - 175 angstrom (0.07 - 10 keV); ACIS-S coverage is 1.2 - 65 Å (0.20 - 10 keV).
X-ray Pulsars with Chandra
We will be doing three small excerises just to have an exposure of Chandra's capabilities. One of these excersizes is to examine high resolution X-ray image of Vela pulsar and its nebula. You are given an X-ray image (in energy band of 0.1 - 10 keV) of Vela pulsar taken with HRC-I camera of Chandra, HRC-I has a field of view of 30arcmin by 30 arcmin, so the image is really a wide angle view. The name of fits file containing the image is vela_wide_angle.fits. Your job is to display the image and examine. The image displaying program is called ds9. Copy the file in your directory and display the image by typing in an Xterm window (Linux or Unix systems):
pulsa> ds9 vela_wide_angle.fits
The image is displayed in grayscale. To change the display levels, drag
the cursor while pressing the third mouse button. To change the color,
point your mouse to the icon "color" in the image viewer and press the
left mouse button, this will show different color options in a row just
below the icon "color". Select one of these color, for example, blue and
you see a blue picture. Examine the images by selecting other colors except
"cmap". You can transform the intensity in logarithmic scale in order to
see the faintest and brightest features together by clicking "scale" and
then "log". Drag the cursor while pressing the
third mouse button. You can Zoon in/out by clicking to "Zoom" and then
"in" or "out". You can plot iso-inensity levels called contours levels
on your image. To do this, click on the Analysis Menu on the top the image
viewer, then select "Display contours". You can change the contour levels
again by clicking on the "Analysis" menu and then selecting "Contour parameters".
This will open a new window, where you can select no. of contours to be
drawn, the smoothness level of comtours. A high value of smoothness would
not show finer details of the image and the lowest value would show noise
level (not real features) if the no. of contour selected is large.
Figure. 5 HRC-I image of the Vela Pulsar and Nebula
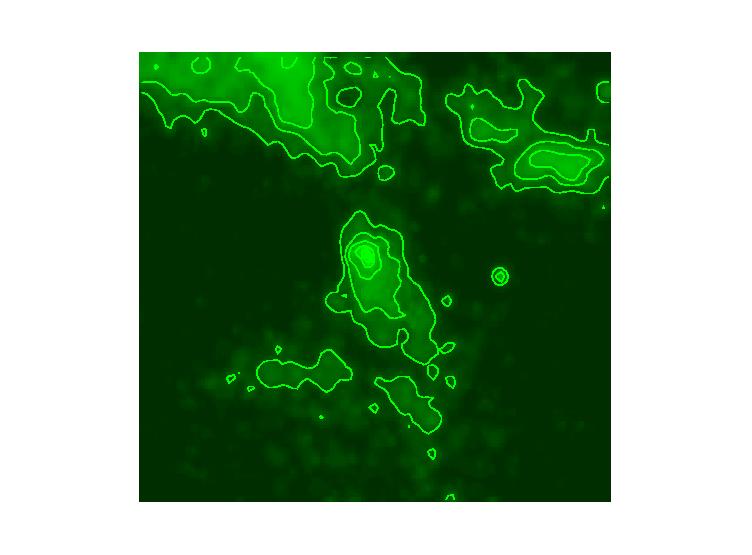
What does the image tell us?
In this wide-angle view, the Vela pulsar and
its pulsar wind nebula are seen against a background
of clouds, or filaments, of multi-million degree Celsius gas. These
clouds are part of a huge sphere of
hot expanding gas produced by the supernova explosion associated with
the creation of the vela pulsar about 10,000 years ago. As the ejecta from
the explosion expanded into space and collided with the surrounding interstellar
gas, shock waves were formed and heated the gas and ejecta to millions
of degrees. The sphere of hot gas is about 100 light years across, 15 times
larger than the region shown
in this image, and is expanding at a speed of about 400,000 km/hr.
The Vela pulsar, located in the
center of the image , is considered to be one of Chandra's most tantalizing
images to date. It reveals a striking, almost unbelievable, structure consisting
of bright rings and jets of matter. Such structures indicate that mighty
ordering forces must be at work amidst the chaos of the aftermath of a
supernova explosion. Forces can harness the energy of thousands of suns
and transform that energy into a
tornado of high-energy particles that astronomers refer to as a "pulsar
wind nebula."
ACIS-S Image of the Crab Nebula:
Figure 6. ACIS-S Image of the Crab Nebula

Image file : acisf01999N001_cntr_img2.fits.gz
Display the image as done earlier. Move the cursor while pressing third mouse button to best see the structures. Change the linear scale to log scale and move the cursor while pressing the third mouse button. Change the grey scale to green and then red. There are two parallel lines in the image, one is dark and the other is bright. These are not real features. The dark line is due to the gap between the CCD detectors. The gap is not sensitive to X-rays. Remeber ACIS-S is an array of 1 by 6 CCDs. The image covers two CCDs partially. Crab Nebula is a very bright, and the CCD pixels correspondings to the centre (position of pulsar) of the Nebula are saturated, that means the amount of charge produced as result of photo-electric absorption of X-rays is higher than the capacity of CCD pixels. Thus the charges over flow along the direction of charge transfer resulting in bright line seen in the image. The image is 2.5 arcmin on a side and shows remnant of a supernova which ocurred in 1054 AD. At the center of the nebula is a rapidly spinning neutron star, or pulsar (central black point in the image) that emits pulses of radiation 30 times a second. The central pulsar is surrounded by tilted rings of high-energy particles that appear to have been flung outward over a distance of more than a light year from the pulsar. Perpendicular to the rings, jet-like structures produced by high-energy particles blast away from the pulsar. The diameter of the inner ring in the image is about one light year, more than 1000 times the diameter of our solar system. The X rays from the Crab nebula are produced by high-energy particles spiraling around magnetic field lines in the Nebula. The bell-shaped appearance of the Nebula could be due to the way this huge magnetized bubble was produced or to its interaction with clouds of gas and dust in the vicinity.
High Resolution X-ray spectrum of Binary X-ray Pulsar Vela X-1:
Massive early type stars such as O, B lose their mass substantially by the strong stellar winds, which arise due to the radiative acceleration by the stellar UV radiation through absorption and scattering. If such stars are in a binary system with a neutron star, a fraction of stellar wind gets swept up by the neutron star. This generates a strong X-ray continuum. X-ray photons from the accreting neutron star are reprocessed in the wind and result in descrete emission lines. Vela X-1 is such a system. The primary stars is massive B-type supergiant with mass of 23 solar mass and radius 34 solar radii. The neutron star exhibits 282 seconds X-ray pulsations and orbits the centre of the mass of the system with a period of 8.96 days. Vela X-1 was observed with the HETGS onboard Chandra. You are provided the first order MEG spectrum of Vela X-1 and corresponding instrument response files. The files are
(1) 1st order MEG spectrum -- velax1_meg1.pha
(2) Response matrix file -- acis_meg1.rmf
(3) Effecctive area file -- acisf01926_MEG_1.arf
(4) Sets the plotting parameters --
velax1_meg1.pco
To view the spectrum, type
unix prompt> xspec
XSPEC> data velax1_meg1.pha
XSPEC>cpd /xw
XSPEC>setplot wave
XSPEC>ip data
PLT>@velax1_meg1.pco
Figure 7. First Order MEG spectrum of Vela X-1

This will plot the spectrum with strong emission
lines indentified. The spectrum shows lines from a variety of charge states
of different elements e.g., Si, Mg, Fe, Ne. X-ray line spectroscopy provides
an opportunatity to study the physical conditions of material at
very high temperatures. The relative intensities of the lines provide
information about the line emission processes (such as recombination followed
by photoionization, shock excitation/ionization). Some of the forbidden
lines provide information about the density of the line emitting material.
Line profiles and line shifts tell about the motion of the material. In
situations where we are not able to resolve spatially the line emitting
region and if the lines arise due to reprocessing then the delay between
continuum and line emission tells about the size of the region.
The first Chandra/HETGS
spectrum of Vela X-1 has been analyzed by Schulz et al (ApJ, 564, L21).
PLT> quit
XSPEC> exit