Tools for X-ray Astronomy
Astronomy and astrophysics
are the studies of the solar system, the Sun and stars, galaxies
, black holes
, and the Universe
as a whole. However, there is a big difference between the science
of astrophysics and the other sciences, such as biology, chemistry and
physics. Almost all other branches of science are truely experimental in
nature, i.e. most scientists can perform experiments where they change
the parameters of a system to see what the effect is. Astronomers can't
do this. They can't change the temperature of a star
and see what happens. They can't add more helium
to the Universe and see what the result is. They can't look at
the Milky Way from different viewing angles. They can't repeat the conditions
of the birth of the solar system, or the early Universe. The "experiment"
is in progress, and astronomers can only take the very best measurements
possible, and study them very carefully to infer what is going on in
the Universe around us.
Therefore astronomy is called an "observational science" and the only
way to get information about the distant objects and study their properties
is, to analyse the "light", or in broad sense the electromagnetic radiation,
we get from them. In X-ray range, photons have
sufficient energy so that individual photons can be detected in the detector.
Also because of higher energy of individual photon, total number of photons
we get from any source is also much less then that during an optical
observation. In a typical measurement in X-ray astronomy, three properties
of the incoming photon are measured: the direction in the sky from
where the photon arrived, it's time of arrival and it's energy. These
measurements result in the basic tools of X-ray astronomy: an image, a
light curve and a spectrum. Analysis of each of these - known as
imaging, timing or spectral analysis - reveals different aspect of the
source and gives slightly differement information.
Imaging
The concept of an image is probably the most familiar - telescopes
like the Hubble Space Telescope produce many beautiful images. However,
images of the same object can look totally different in different electromagnetic
bands. In fact, looking at images of the same object made with different
parts of the electromagnetic spectrum
is a very important tool. Each image tells something unique about
the object at that particular wavelength
, and helps to figure out "the big picture" of what is really
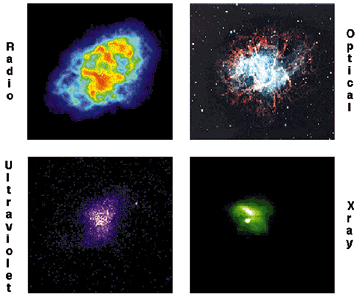
going on with that object. For example, in the figure below, we see
four images of the Crab Nebula. The radio
image tells us about the magnetic fields
and free electrons
in the Nebula. The optical image tells us about the hydrogen
in the Nebula and more about the free electrons moving in the
magnetic field of the pulsar
. The UV image tells us about the cooler electrons, while the
X-ray image tells us about the very hot electrons which are coming
from the collapsed central object in the Nebula.

Figure 1
An image basically shows the brightness of an object in the
spatial domain, i.e. how many photons
are coming from a specific location in space. The ability of
a detector to seperate one location from a nearby location, known as
spatial resolution
, is the most crucial parameter for imaging analysis. The
spatial resolution of X-ray detectors is much poor compared to those lower
energy bands. The real feasibility of imaging analysis in X-ray astronomy
has emerged only very recently with new missions like Chandra and XMM-Newton,
and that is also limited to low energy X-rays below 10 keV. In this workshop
we shall not be discussing much about imaging analysis, mainly because
all X-ray pulsars are expected to be point sources and present imaging analysis
does not give more information then that.
Light curves
A light curve is a graph which shows the brightness of an
object over a period of time. In the study of objects which change their
brightness over time, such as novae
, supernovae
, and variable stars
, the light curve is a simple but valuable tool to study their
properties. The record of changes in brightness that a light curve
provides can help us to understand processes at work within the source
and identify specific category (or class) to which the source belongs.
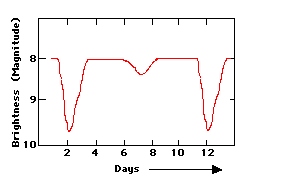
For example, the light curve of an eclipsing
binary star
is shown in Figure 2. It tells us that it takes 10 days for
one of the stars in the binary to orbit
completely around the other, or in other words, "the orbital period
of the binary system is 10 days."

Figure 2
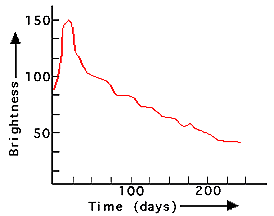
A typical light curve of a supernova explosion is shown in
Figure 3.

Figure 3
Thus, just by looking at the light curve of an unknown object
it can be associated or rejected with certain class. However, the timing
analysis is not just limited to broad classification, but can give a much
deeper insight to the actual physical conditions in many types of sources,
particularly for X-ray pulsar sources. Therefore we shall have a detailed
introduction to timing analysis in the next section.
Spectrum
A spectrum is basically a graph of intensity of the radiation
with respect to energy. In general, we spread out radiation into tiny
increments of energy (or wavelength
) in order to examine all of its parts. There are different methods
to spread out the radiation depending on the particular region of the
electromagnetic band. For exanple, most familiar method to all of us is
the use of prism to seperate colours of the white light. Another method
is to use diffraction gratting, which can be used to get spectrum of optical
light, UV light and even low energy X-rays. For higher energy X-rays,
generally it is possible to measure energy of individual incoming photon,
and thus we can easily get the spectrum.
Each spectrum holds a wide variety of information. However, extracting
this information involves a complex process and a detailed understanding
of the underlying physics. We shall have a detailed introduction to
spectral analysis in a coming section.
|


