Timing Analysis: Exercise 4
Effect of change in pulse period
In previous two exercise we have assumed that the pulse period is constant.
However this is not always the case. Many X-ray pulsars show intrinsic period
change with time. Though this change might be vary small, it effects the final
result if we do not take it into account while determining the period.
In this exercise we shall study the effect of the change in pulse period
with time for the X-ray pulsar
XTE J1946+274
. For this we shall use a light curve observed with IXAE (Indian X-ray Astronomy
Expertiment). We shall use the same tasks
efsearch
and
efold
.
Copy the light curve XTE_1946+274_ixae.lc from the
'data' directory.
First determine best period using efsearch, without considering
change in pulse period i.e. by giving period derivative = 0.
Invoke efsearch and provide different parameters as shown below:
pulsar> efserach

efsearch 1.1 (xronos5.18)

Ser. 1 filename +options (or @file of filenames +options)[file1]
XTE_1946+274_ixae.lc
 Series 1 file   1:XTE_1946+274_ixae.lc
WARNING:  Defaulting to first FITS extension

 Selected FITS extensions: 1 - RATE TABLE;

 Source ............                     Start Time (d) .... 11723 18:03:40.786
 FITS Extension ....  1 - `          `   Stop Time (d) ..... 11732 16:47:25.887
 No. of Rows .......        32469        Bin Time (s) ......    1.020
 Right Ascension ...                     Internal time sys.. Converted to TJD
 Declination .......                     Experiment ........

 Corrections applied: Vignetting - No ; Deadtime - No ; Bkgd - Yes; Clock - Yes
             values: 1.00000000       1.00000000       1.00000000

 Selected Columns:  1- Time;  2- Y-axis;  3- Y-error;

 File contains binned data.

Name of the window file ('-' for default window)[-] -

 Expected Start ... 11723.75255539586  (days)      18: 3:40:786  (h:m:s:ms)
 Expected Stop .... 11732.69960517328  (days)      16:47:25:887  (h:m:s:ms)

 Default Epoch is:  11723.00000
Type INDEF to accept the default value
 Epoch format is days.
Epoch[34 234.23] 11723.00000
 Period format is seconds.
Period[88.87] 15.8
Period derivative       [0] 0
 Expected Cycles ..          48925.64
 Default phase bins per period are:         8
 Type INDEF to accept the default value
Phasebins/Period {value or neg. power of 2}[-3] 16
 Newbin Time ......    0.98750000      (s)
 Maximum Newbin No.            782811

 Default Newbins per Interval are:      782811
 (giving       1 Interval of       782811 Newbins)
 Type INDEF to accept the default value

Number of Newbins/Interval[10] 782811
 Maximum of       1 Intvs. with       782811 Newbins of      0.987500     (s)
 Default resolution is 0.1614693713E-03
 Type INDEF to accept the default value
Resolution for period search {value or neg. power of 2}[.03] 0.0001
 Default number of periods is       128
 Type INDEF to accept the default value
Number of periods to search[100] 4096
Name of output file[default]
Do you want to plot your results?[yes]
Enter PGPLOT device[/XW]

    4096 analysis results per interval

WARNING:  Defaulting to first FITS extension
  Chisq. vs. period ready

 Period :   15.77    dP/dt :   0.000
 Intv    1   Start 11723 18: 3:41
     Ser.1     Avg  34.32        Chisq  371.3       Var 0.3849     Newbs.     16
               Min  33.22          Max  35.24    expVar 0.1658E-01  Bins  32460
PLT>
This will take little long time becaue the light curve is made from all
the observations spanning 10 days.
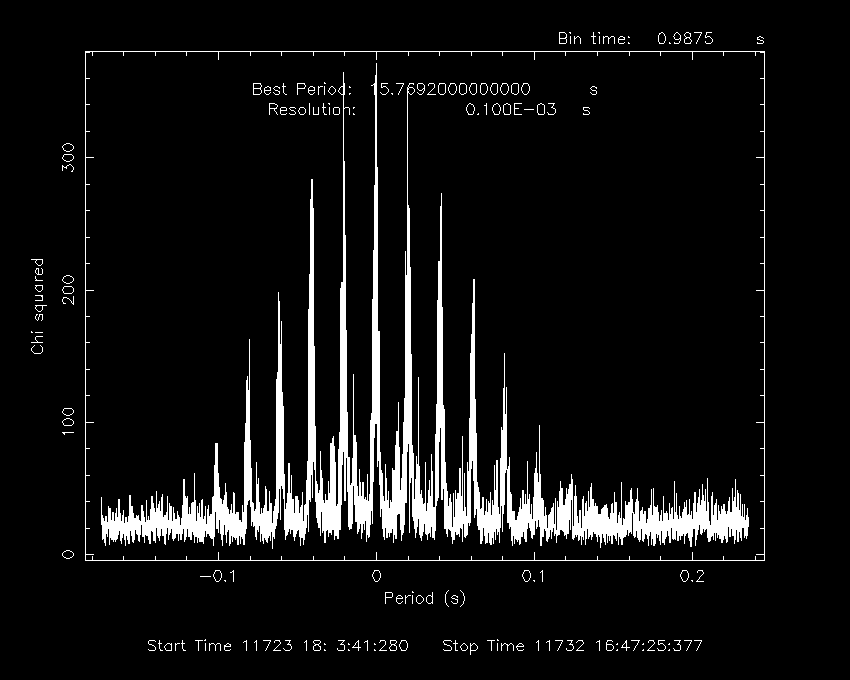
You can see that the result is not very clean as in the last exercise
and there are many peaks in the plot. The reason is that the light curve
is not continuous. You can verify this by looking at the light curve with
lcurve . This is because, the orbit of the host satellite of IXAE,
IRS-P3, is a polar orbit. Polar region has very high concentration of charged
particles and hence X-ray observations can not be carried out in those regions.
Anyway, note down the best period and maximum chi-square corresponding
to the best period. You can see the pulse profile by folding the light curve
with the best period obtained above.
Now again run efsearch, and give period derivative of 1.9e-9. This
will take even longer time so please be patient.
pulsar> efsearch

efsearch 1.1 (xronos5.18)

Ser. 1 filename +options (or @file of filenames +options)[file1]
XTE_1946+274_ixae.lc
 Series 1 file   1:XTE_1946+274_ixae.lc
WARNING:  Defaulting to first FITS extension

 Selected FITS extensions: 1 - RATE TABLE;

 Source ............                     Start Time (d) .... 11723 18:03:40.786
 FITS Extension ....  1 - `          `   Stop Time (d) ..... 11732 16:47:25.887
 No. of Rows .......        32469        Bin Time (s) ......    1.020
 Right Ascension ...                     Internal time sys.. Converted to TJD
 Declination .......                     Experiment ........

 Corrections applied: Vignetting - No ; Deadtime - No ; Bkgd - Yes; Clock - Yes
             values: 1.00000000       1.00000000       1.00000000

 Selected Columns:  1- Time;  2- Y-axis;  3- Y-error;

 File contains binned data.

Name of the window file ('-' for default window)[-] -

 Expected Start ... 11723.75255539586  (days)      18: 3:40:786  (h:m:s:ms)
 Expected Stop .... 11732.69960517328  (days)      16:47:25:887  (h:m:s:ms)

 Default Epoch is:  11723.00000
Type INDEF to accept the default value
 Epoch format is days.
Epoch[34 234.23] 11723.00000
 Period format is seconds.
Period[88.87] 15.8
Period derivative       [0] 1.9e-9
 Expected Cycles ..          48925.64
 Default phase bins per period are:         8
 Type INDEF to accept the default value
Phasebins/Period {value or neg. power of 2}[-3] 16

 Newbin Time ......    0.98750000      (s)
 Maximum Newbin No.            782811

 Default Newbins per Interval are:      782811
 (giving       1 Interval of       782811 Newbins)
 Type INDEF to accept the default value

Number of Newbins/Interval[10] 782811
 Maximum of       1 Intvs. with       782811 Newbins of      0.987500     (s)
 Default resolution is 0.1614693713E-03
 Type INDEF to accept the default value
Resolution for period search {value or neg. power of 2}[.03] 0.0001
 Default number of periods is       128
 Type INDEF to accept the default value
Number of periods to search[100] 4096
Name of output file[default]
Do you want to plot your results?[yes]
Enter PGPLOT device[/XW]

    4096 analysis results per interval

WARNING:  Defaulting to first FITS extension
  Chisq. vs. period ready

 Period :   15.77    dP/dt :  0.1900E-08
 Intv    1   Start 11723 18: 3:41
     Ser.1     Avg  34.32        Chisq  1259.       Var  1.306     Newbs.     16
               Min  32.20          Max  35.81    expVar 0.1658E-01  Bins  32460
PLT>
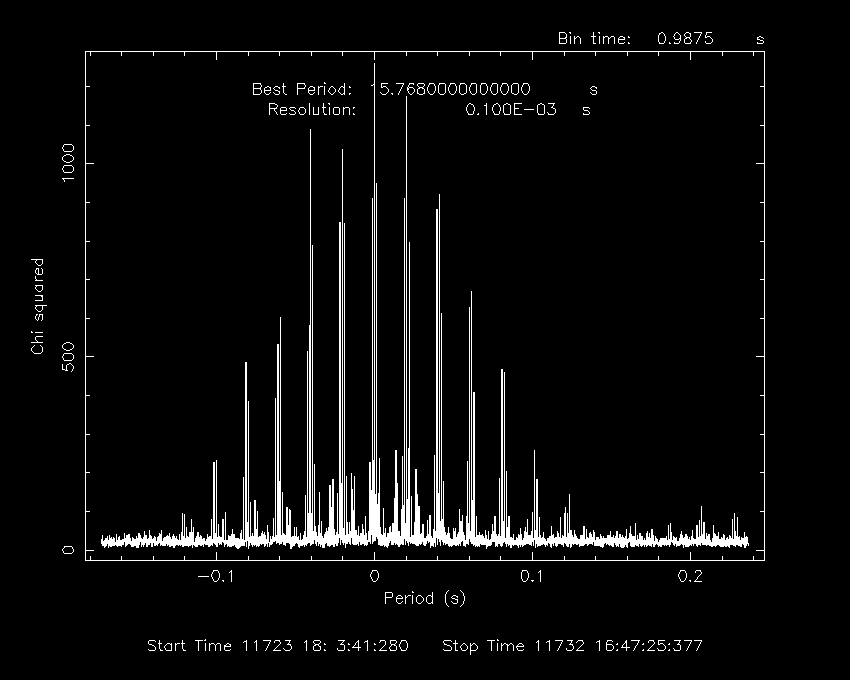
Notice the difference between this and previous plot and note down the
maximum chi-square corresponding to the best period. See how the best period
changes and its significance increase by incorporating the period derivative.
|