Timing Analysis: Exercise 7
Quasi Peridic Oscillations in X-ray Pulsars
We have seen in all the previous exercises that the signals present in
the data are strictly periodic. The fourier transform of such periodic signals
are almost like delta functions, which gives a sharp peak in the power
density spectrum. But this is not the case always, there are some signals
which are not strictly periodic and are called Quasi Periodic Oscillations
or in short QPOs. Since these are not periodic signals, the fourier
transform of such signals is not a delta function. Instead it shows a broad
peak in the power density spectrum. Often the amplitude of the signal of
a QPO is comparatively smaller than the amplitude of a periodic signal and
spread
over a frequency range making it hard to detect.
We can use the same task
powspec
to search for QPOs present in the data. The data we are going to analyze
for this exercise is taken from PCA instrument on board RXTE satellite for
a pulsar XTE J1858+034
.
Copy the light curve InvokeXTE_J1858+034_pca.lc
and invoke the task powspec by giving the command at the
prompt.
pulsar> powspec
powspec 1.0 (xronos5.18)

Ser. 1 filename +options (or @file of filenames +options)[file1] XTE_J1858+034_pca.lc
 Series 1 file   1:XTE_J1858+034_pca.lc

 Selected FITS extensions: 1 - RATE TABLE;

 Source ............ XTEJ1858+034        Start Time (d) .... 10868 10:43:11.562
 FITS Extension ....  1 - `RATE      `   Stop Time (d) ..... 10868 11:37:03.562
 No. of Rows .......        25856        Bin Time (s) ......   0.1250
 Right Ascension ... 2.84730011E+02      Internal time sys.. Converted to TJD
 Declination ....... 3.41000009E+00      Experiment ........ XTE      PCA
 Corrections applied: Vignetting - No ; Deadtime - No ; Bkgd - No ; Clock - Yes
 Selected Columns:  1- Time;  2- Y-axis;  3- Y-error;  4- Fractional exposure;

 File contains binned data.

Name of the window file ('-' for default window)[-] -

 Expected Start ... 10868.44666160222  (days)      10:43:11:562  (h:m:s:ms)
 Expected Stop .... 10868.48406900962  (days)      11:37: 3:562  (h:m:s:ms)

 **** Warning: Newbin Time must be an integer multiple of Minimum Newbin Time
 Minimum Newbin Time   0.12500000      (s)
 for Maximum Newbin No..            25857

 Default Newbin Time is:  0.50000000    (s) (to have 1 Intv. of    8192 Newbins)
 Type INDEF to accept the default value

Newbin Time or negative rebinning[0.125] 0.125

 Newbin Time ......    0.12500000      (s)
 Maximum Newbin No.             25857
These inputs are very similar to that supplied in Exercise-2. You give
the appropriate file name containing light curve, default window file and
newbin time which is integer multiple of the minimum newbin time.
 Default Newbins per Interval are:        8192
 (giving       4 Intervals of         8192 Newbins each)
 Type INDEF to accept the default value

Number of Newbins/Interval[8192] 8192
 Maximum of       4 Intvs. with         8192 Newbins of      0.125000     (s)
Default intervals per frame are:         4
Type INDEF to accept the default value
Number of Intervals/Frame[4] 4
 Results from up to       4 Intvs. will be averaged in a Frame
We have used the default number of newbins per interval (i.e. 8192) which
will give us total of 4 intervals per frame. In the following we use a geometric
rebinning to plot the data. This gives a better appearance to the
result.
Rebin results? (>1 const rebin, <-1 geom. rebin, 0 none)[-1.05] -1.05
 Results will be rebinned geometrically  with a series of step    1.05
Name of output file[default]
Do you want to plot your results?[yes]
Enter PGPLOT device[/XW]

    4096 analysis results per intv. will be rebinned to     109

 31% completed
 Intv    1   Start 10868 10:43:11
     Ser.1     Avg  291.3        Chisq 0.1233E+05   Var  3507.     Newbs.   8192
               Min  112.0          Max  552.0    expVar  2330.      Bins   8192
Power spectrum ready !
 Intv    2   Start 10868 11: 0:15
     Ser.1     Avg  299.2        Chisq 0.1224E+05   Var  3578.     Newbs.   8192
               Min  104.0          Max  624.0    expVar  2394.      Bins   8192
Power spectrum ready !
 Intv    3   Start 10868 11:17:19
     Ser.1     Avg  325.0        Chisq 0.1479E+05   Var  4696.     Newbs.   8192
               Min  120.0          Max  688.0    expVar  2600.      Bins   8192
Power spectrum ready !
100% completed
 Intv    4   Start 10868 11:34:23
     Ser.1     Avg  356.7        Chisq  2043.       Var  4554.     Newbs.   1280
               Min  160.0          Max  608.0    expVar  2853.      Bins   1280
            Interval rejected because of window(s)  in series 1 !
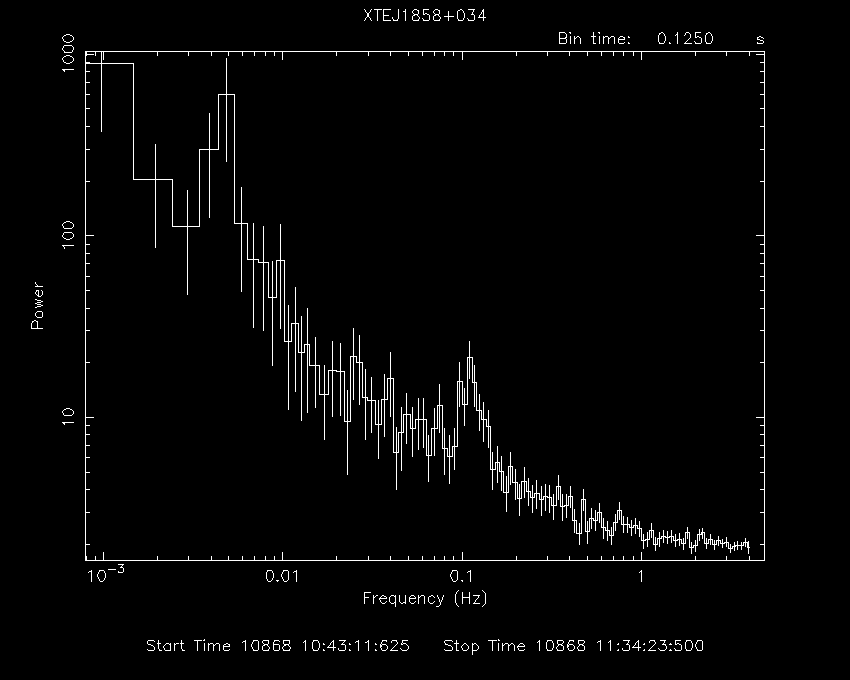
The power spectrum will look like as shown below.

You can clearly see a broad peak at the frequency of about 0.1 Hz. This
indicates the presence of 0.1 Hz QPO in the source XTE J1858+034. Also
the amplitude of the QPO is relatively small.
This pulsar has a spin period of 221 s and also gives a quasi-periodic
signal of 0.11 Hz. The quasiperiodic
signal is most likely related to some phenomena in the accretion disk.
|


