Timing Analysis: Exercise 8
kHz QPO in X-ray Pulsars
In the previous exercise we searched for the quasi periodic oscillations
in an X-ray pulsar. Here we will analyse again the RXTE PCA light curve
of a low mass X-ray binary called
4U 1728-34
to search for the kHz QPOs means QPO near the frequencies of few
hundred Hz.
Before starting the kHz QPO search let us have a look at the light curve
4U_1728-34_pca.lc
using
lcurve
. It shows a constant count rate for most of the time and a huge
X-ray burst near the end of the light curve. This type of burst is known
as type-1 X-ray burst. We will search for kHz QPO using a vary high time
resolution light curve made from a small portion of this observation where
the count rate is nearly constant.
First copy the light curve
4U_1728-34_pca1.lc
. This light curve has time resolution of 125 microsecond, which allows
us to create power density spectrum upto 4 kHz.
In the next problem, we will take a high time resolution light curve of
the decaying part of the burst. We will be able to detect coherent
high frequency pulsations during the type I burst decay.
The time resolution in these two light curves is 125 microsecond, which
allows us to create power density spectrum upto 4 kHz.
As usual invoke the
powspec
task from the command line.
pulsar> powspec

powspec 1.0 (xronos5.18)

Ser. 1 filename +options (or @file of filenames +options)[file1] 4U_1728-34_pca1.lc
 Series 1 file   1:4U_1728-34_pca1.lc

 Selected FITS extensions: 1 - RATE TABLE;

Source ............ 1728-34             Start Time (d) .... 10129 09:34:43.562
FITS Extension ....  1 - `RATE      `   Stop Time (d) ..... 10129 09:43:03.563
No. of Rows .......      3992001        Bin Time (s) ......   0.1250E-03
Right Ascension ... 2.62989197E+02      Internal time sys.. Converted to TJD
Declination ....... -3.38345985E+01     Experiment ........ XTE      PCA

Corrections applied: Vignetting - No ; Deadtime - No ; Bkgd - No ; Clock - Yes

 Selected Columns:  1- Time;  2- Y-axis;  3- Y-error;  4- Fractional exposure;

 File contains binned data.

Name of the window file ('-' for default window)[-]-

Expected Start ... 10129.39911530592  (days)       9:34:43:562  (h:m:s:ms)
Expected Stop .... 10129.40490234441  (days)       9:43: 3:563  (h:m:s:ms)

 **** Warning: Newbin Time must be an integer multiple of Minimum Newbin Time
Minimum Newbin Time   0.12500000E-03  (s)
for Maximum Newbin No..          4000002

Default Newbin Time is:  0.61125000E-01(s) (to have 1 Intv. of    8192 Newbins)
Type INDEF to accept the default value

Newbin Time or negative rebinning[0.125] 0.000125

Newbin Time ......    0.12500000E-03  (s)
Maximum Newbin No.           4000002

Default Newbins per Interval are:        8192
(giving     489 Intervals of         8192 Newbins each)
Type INDEF to accept the default value

Number of Newbins/Interval[8192] 1024
 Maximum of    3907 Intvs. with         1024 Newbins of      0.125000E-03 (s)
Default intervals per frame are:      3907
Type INDEF to accept the default value
Number of Intervals/Frame[4] 3907
 Results from up to    3907 Intvs. will be averaged in a Frame
Rebin results? (>1 const rebin, <-1 geom. rebin, 0 none)[-1.05] -1.01
Results will be rebinned geometrically  with a series of step    1.01
Name of output file[default]
Do you want to plot your results?[yes]
Enter PGPLOT device[/XW]
The input parameters are similar to that explained in the previous exercises.
At this point be patience and wait for some time.
Here the number of intervals per frame is very large (3907) which means
that the analysis will be carried out in 3907 different independent segments
of the light curve. So it will take bit longer time to complete the analysis
and produce the final power density spectrum. You may enjoy a cup of tea
as the computer does the number crunching.
       512 analysis results per intv. will be rebinned to     196
 Intv    1   Start 10129  9:34:43
    Ser.1     Avg  1976.        Chisq  947.9       Var 0.1530E+08 Newbs.   1024
               Min  0.000          Max 0.2458E+05expVar 0.1606E+08  Bins   1024
Power spectrum ready !
 Intv    2   Start 10129  9:34:43
     Ser.1     Avg  2120.        Chisq  924.4       Var 0.1589E+08 Newbs.   1024
               Min  0.000          Max 0.2458E+05expVar 0.1720E+08  Bins   1024
Power spectrum ready !
 Intv    3   Start 10129  9:34:43
     Ser.1     Avg  1992.        Chisq  985.8       Var 0.1530E+08 Newbs.   1024
               Min  0.000          Max 0.1638E+05expVar 0.1606E+08  Bins   1024
Power spectrum ready !
Intv    4   Start 10129  9:34:43
     Ser.1     Avg  2016.        Chisq  1002.       Var 0.1612E+08 Newbs.   1024
               Min  0.000          Max 0.2458E+05expVar 0.1629E+08  Bins   1024
Power spectrum ready !
Here we have shown only 4 intervals but actually there will be 3907 such
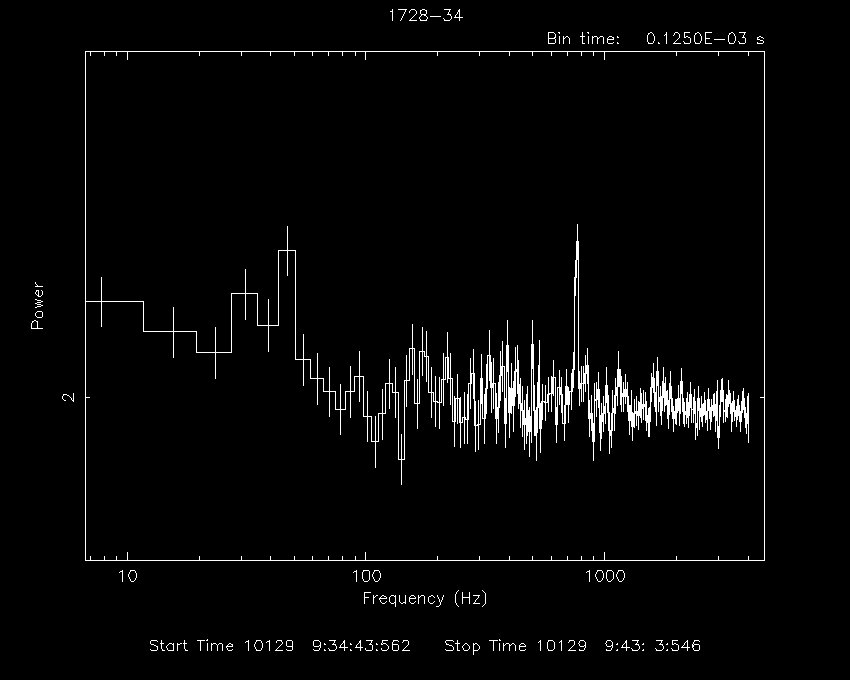
intervals and then finally you should get your power density spectrum as
shown below.
You can resize the spectrum using the PLT commands. The spectrum below
is already resized. Give following command at PLT prompt to obtain the plot
shown below. For better view rescale y-axis using the commamd given below.
PLT> r y 1.8 2.5
PLT> quit

In the above power density spectrum you can see a peak near frequency
of about 800 Hz. As mentioned above this peak suggest the presence of
kHz QPOs in the source 4U 1728-34. You can resize the plot using PLT
command and find out the accurate frequency for the QPO.
|


