Timing Analysis: Exercise 9
High frequency Oscillations during Type-1 X-ray bursts
In this exercise we shall see how to find high frequency oscillations
in an X-ray pulsar from the RXTE PCA light curve. Here again we will use
the data from the same source as in the previous exercise,
4U 1728-34
. The high frequency oscillations are also periodic signals so we should
get a narrow signal when we take the fourier transform of such time series
and power density spectrum should show a sharp peak.
Copy the light curve 4U_1728-34_pca2.lc
and Invoke powspec command and provide different parameters as inputs.
pulsar> powspec

powspec 1.0 (xronos5.18)

Ser. 1 filename +options (or @file of filenames +options)[file1] 4U_1728-34_pca2.lc
 Series 1 file   1:4U_1728-34_pca2.lc

 Selected FITS extensions: 1 - RATE TABLE;

 Source ............ 1728-34             Start Time (d) .... 10129 10:01:52.562
 FITS Extension ....  1 - `RATE      `   Stop Time (d) ..... 10129 10:02:23.563
 No. of Rows .......       248001        Bin Time (s) ......   0.1250E-03
 Right Ascension ... 2.62989197E+02      Internal time sys.. Converted to TJD
 Declination ....... -3.38345985E+01     Experiment ........ XTE      PCA

 Corrections applied: Vignetting - No ; Deadtime - No ; Bkgd - No ; Clock - Yes

 Selected Columns:  1- Time;  2- Y-axis;  3- Y-error;  4- Fractional exposure;

 File contains binned data.

Name of the window file ('-' for default window)[-] -

 Expected Start ... 10129.41796947259  (days)      10: 1:52:562  (h:m:s:ms)
 Expected Stop .... 10129.41832827033  (days)      10: 2:23:563  (h:m:s:ms)

 **** Warning: Newbin Time must be an integer multiple of Minimum Newbin Time
 Minimum Newbin Time   0.12500000E-03  (s)
 for Maximum Newbin No..           248002

 Default Newbin Time is:  0.38750000E-02(s) (to have 1 Intv. of    8192 Newbins)
 Type INDEF to accept the default value

Newbin Time or negative rebinning[0.0005] 0.0005

 Newbin Time ......    0.50000000E-03  (s)
 Maximum Newbin No.             62001
Provide the different input parameters like light curve file name, window
file and newbin time as shown above.
 Default Newbins per Interval are:        8192
 (giving       8 Intervals of         8192 Newbins each)
 Type INDEF to accept the default value

Number of Newbins/Interval[4096] 4096
 Maximum of      16 Intvs. with         4096 Newbins of      0.500000E-03 (s)
Default intervals per frame are:        16
Type INDEF to accept the default value
Number of Intervals/Frame[16] 1
 Results from up to      16 Intvs. will be averaged in a Frame
Here the default newbins per interval are 8192 giving total 8 intervals.
Since we have given half the value of newbins per interval i.e. 4096, the
analysis will be carried out in total 16 intervals each with 4096 bins.
Give the number of intervals per frame equal to 1, hence it will show
16 different frames one by one every time you give quit command from
PLT prompt.
Rebin results? (>1 const rebin, <-1 geom. rebin, 0 none)[0] 0
Name of output file[default]
Do you want to plot your results?[yes]
Enter PGPLOT device[/XW]
We shall plot the final results without any rebinning. The output file
name is default. Like in exercise-2 user can apply different rebinning
and see the effect.
     2048 analysis results per interval

  6% completed
 Intv    1   Start 10129 10: 1:52
     Ser.1     Avg 0.2032E+05    Chisq  4556.       Var 0.4536E+08 Newbs.   4096
               Min  0.000          Max 0.4710E+05expVar 0.4079E+08  Bins  16384
Power spectrum ready !
 Intv    2   Start 10129 10: 1:54
     Ser.1     Avg 0.1371E+05    Chisq  4218.       Var 0.2844E+08 Newbs.   4096
               Min  0.000          Max 0.3482E+05expVar 0.2753E+08  Bins  16384
Power spectrum ready !
 Intv    3   Start 10129 10: 1:56
     Ser.1     Avg  9584.        Chisq  4319.       Var 0.2048E+08 Newbs.   4096
               Min  0.000          Max 0.2867E+05expVar 0.1925E+08  Bins  16384
Power spectrum ready !
 Intv    4   Start 10129 10: 1:58
     Ser.1     Avg  6918.        Chisq  4224.       Var 0.1440E+08 Newbs.   4096
               Min  0.000          Max 0.2458E+05expVar 0.1391E+08  Bins  16384
There will be 16 such intervals (all of them are not shown here). The purpose
of dividing the entire light curve into 16 different frames is to see the
growth of peak. If we plot all the 16 intervals in one frame then the peak
will be averaged out.
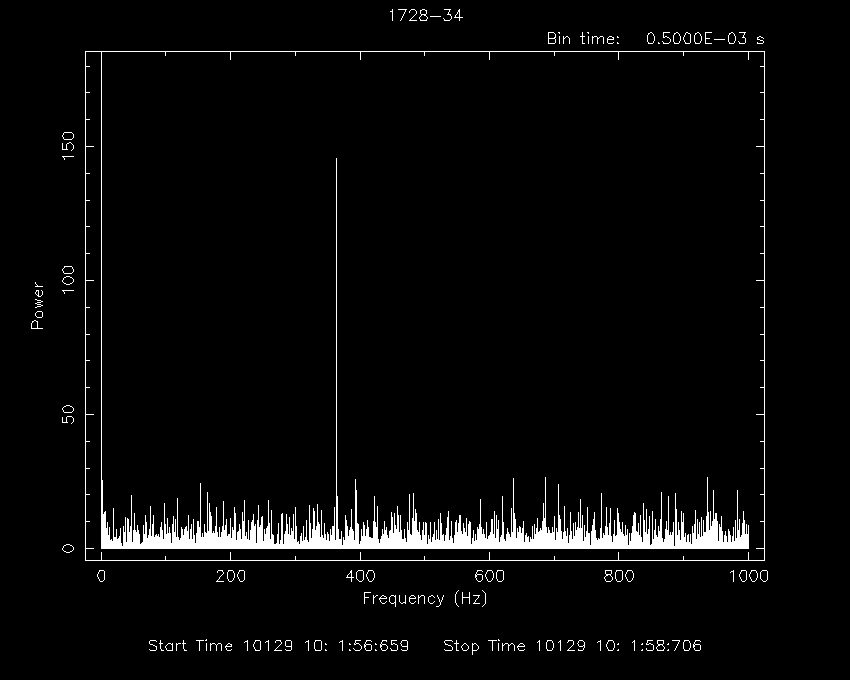
At this point you should see a the Power Density Spectrum generated by
the task powspec using the inputs supplied by you. It contains a clearly
visible significant peak which indicates the presence of high frequency oscillations
at the frequency of about 360 Hz. This spectrum is for third frame
(out of the total 16 frames) which shows peak at its maximum. There is one
more very prominant peak at zero frequency which is due
to decay of the burst at longer time scale and we shall ignore it.
The plot of PDS will look as shown below.

|


